
.png?height=200&name=Blog%20Image%20Size%20(36).png)
Overview
REV 1.1
Step 1 - Navigate to your organization page in the console
Step 2 - Submit the Log File Request
Overview
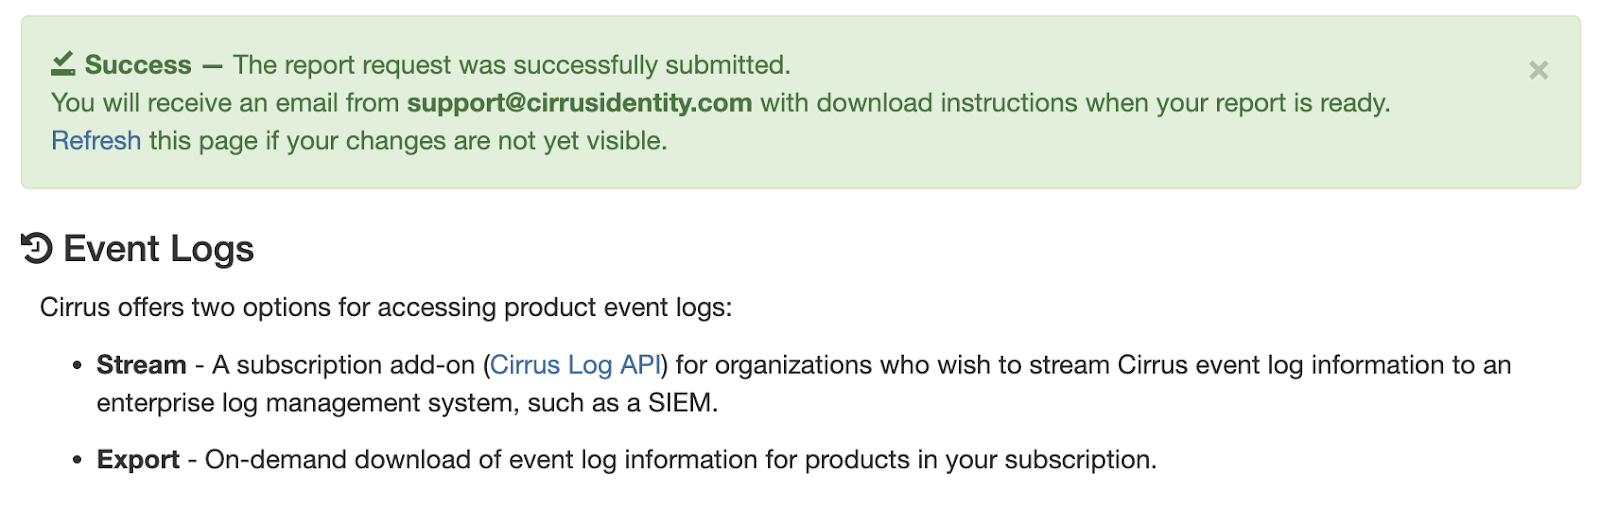
Cirrus offers two options for accessing product event logs:
- Export - On-demand download of event log information for products in your subscription.
- Stream - A subscription add-on (Cirrus Log API) for organizations who wish to stream Cirrus event log information to an enterprise log management system, such as a SIEM.
The base subscription of any Cirrus Identity service allows for self-service access to download up to 90 calendar days of logs using the Cirrus Console. This document outlines how to access those logs.
While there is some variation in the amount of time it takes for processing of logs, the processing will generally be completed and available for download within 10 minutes of the event occurring on any given Cirrus Identity Service.
The files are CSV formatted text files, with formatting options that include JSON, and can be imported into any number of applications for further analysis or reporting.
Download the Event Log File
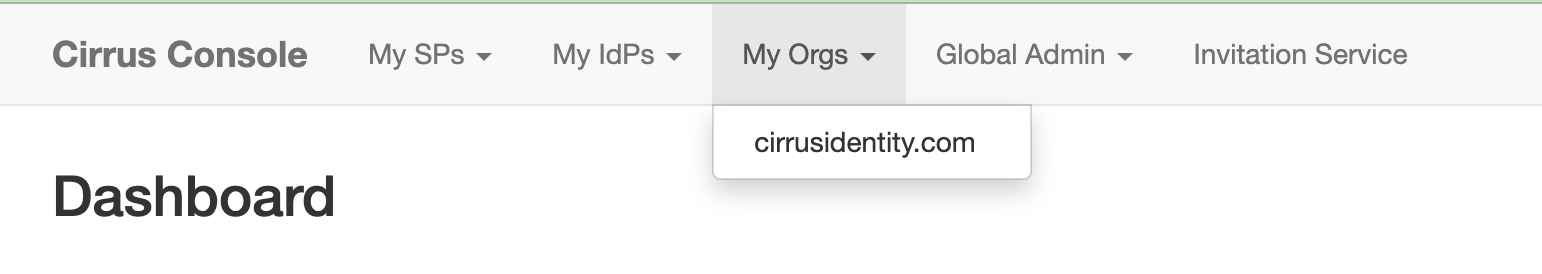
Step 1 - Navigate to your organization page in the console
Event Logs can be downloaded by any Cirrus Console Organization Administrator. To access, first go to the “My Orgs” menu and select the appropriate organization.
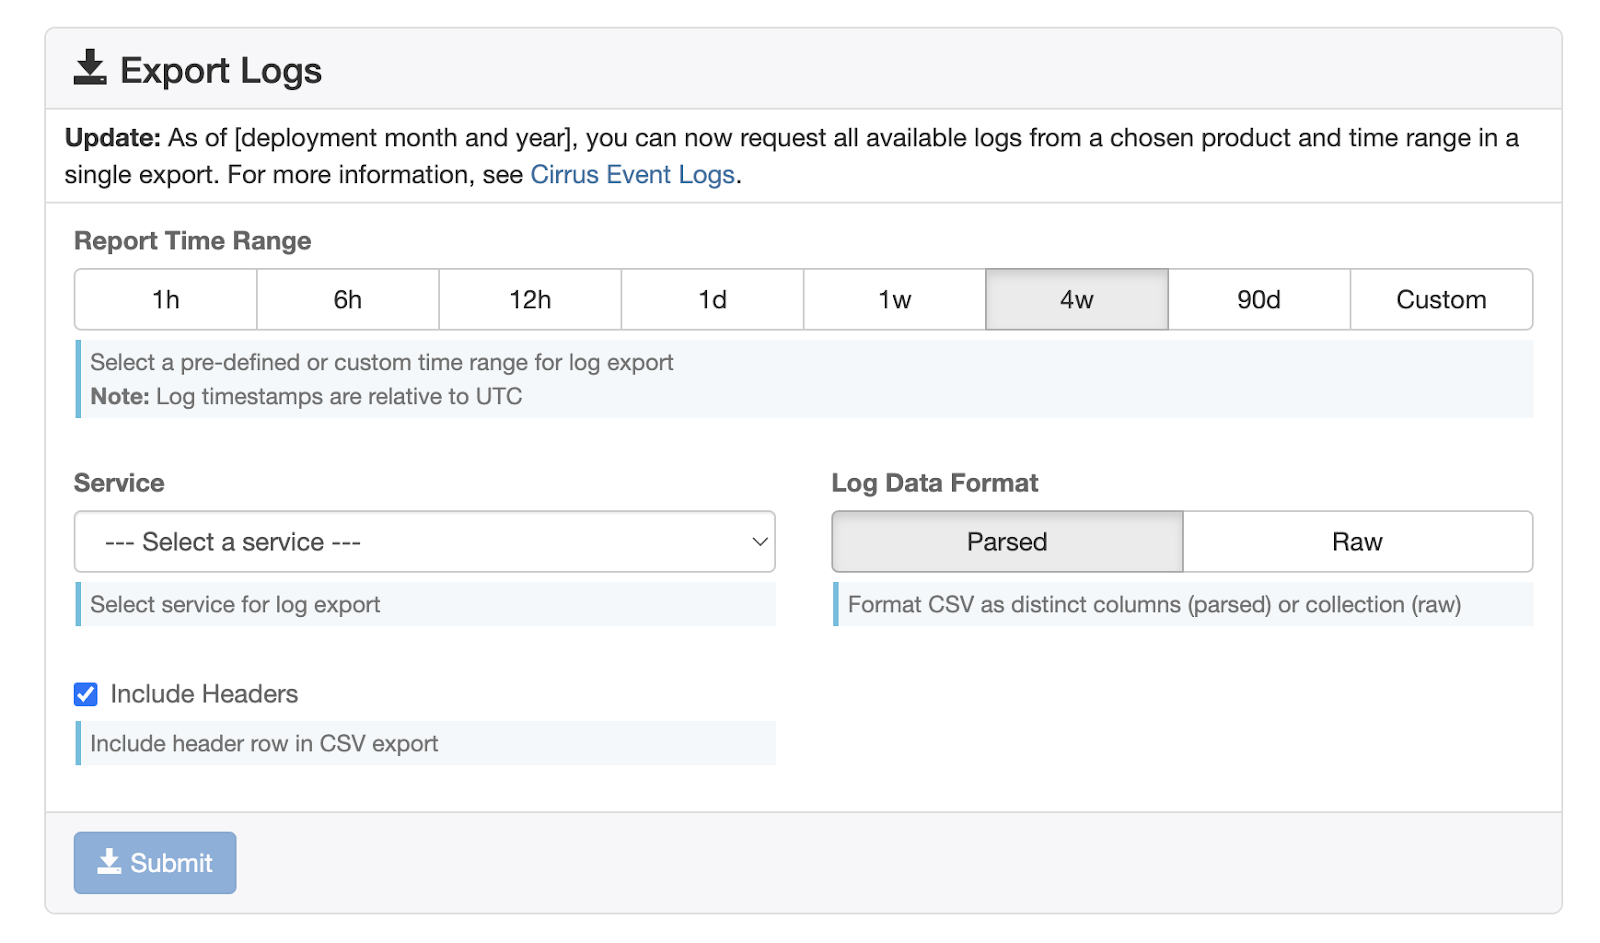
Step 2 - Submit the Log File Request
Select the “Event Logs” page from the menu on the left. Before downloading, you need to provide:
- The “Report Time Range” – this can be relative from the current date and time with a default of 1 hour. By selecting “Custom”, an absolute range can be selected. Times are in UTC and the maximum available history for download is 90 days from the current date.
- The “Service” – this is the specific Cirrus Identity Service module to report on. Event logs are currently available for:
- Cirrus Proxy (proxy)
- Cirrus Bridge (bridge)
- Cirrus Gateway (gateway)
- Cirrus OrgBrandedID (idp)
- The “Metric Data Format” - this indicates whether to automatically parse metric data in output CSV.
- There is an option to include field headers in the download.
Once set, press “Submit” and you should receive feedback that the request was successfully submitted.
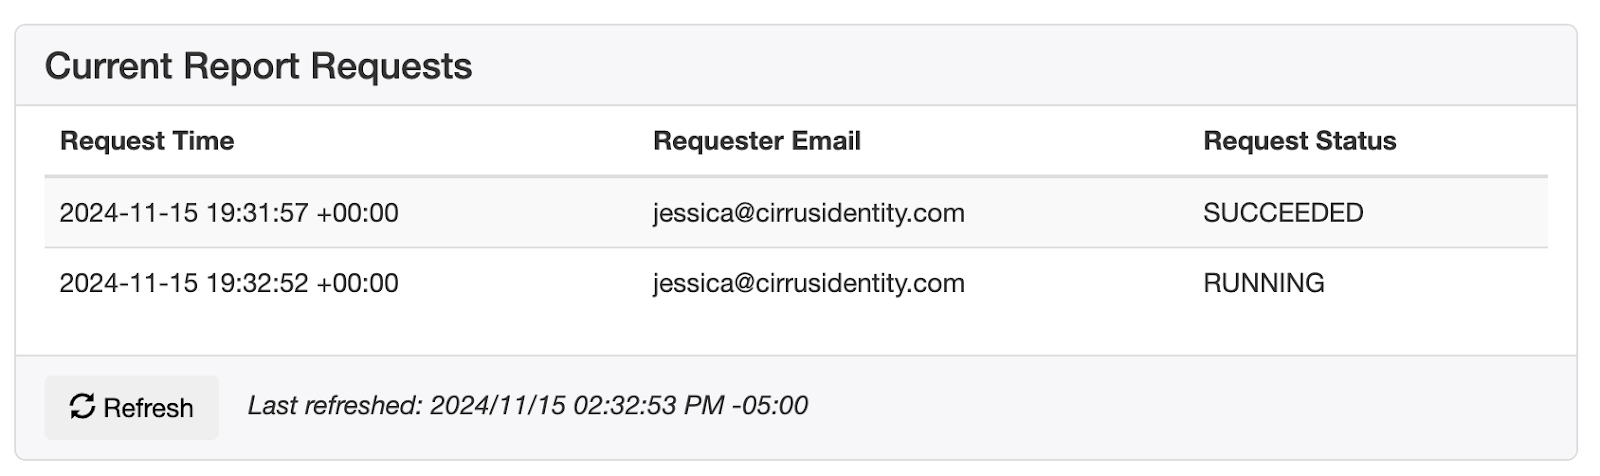
The request will then show in the report requests listing at the bottom of the page. Requests are queued as part of a batch process and will show as RUNNING until it is complete and the download file is generated. To update the Request Status you will need to press the Refresh button.
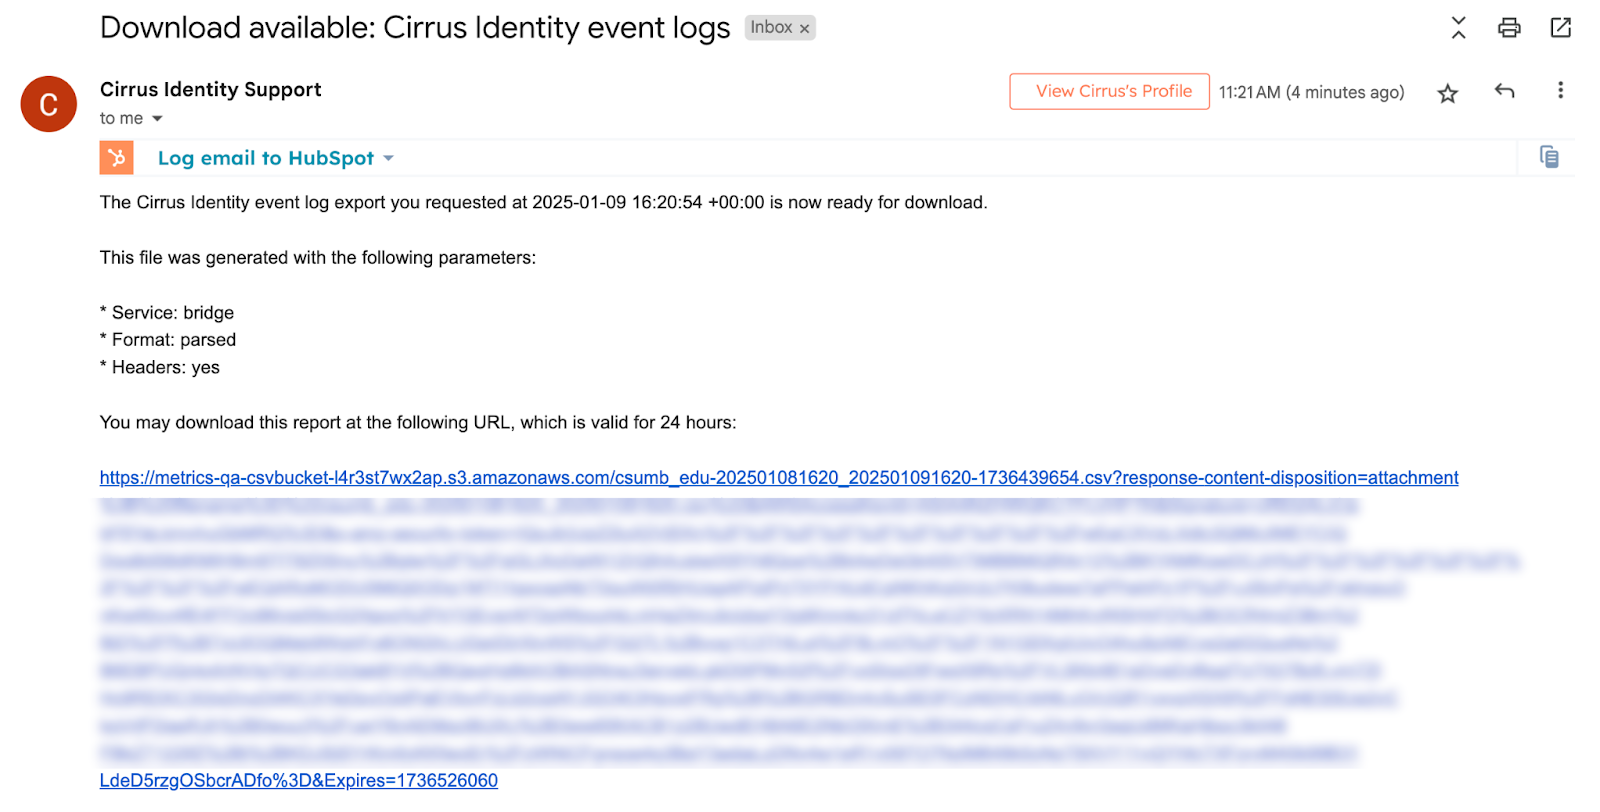
Once the download is generated, you will receive an email sent to the mailbox address associated with the account you logged into the Cirrus Console with. The message will include a link to download the report. The link is only valid for 24 hours. Once the link expires, you must run the report again.
Clicking on the link or pasting the link into a web browser will download the report. Reports are currently formatted as comma separated value (CSV) files. If there is no data in your report, then it typically indicates that there were no log events for the time selected.
Working with Event Log Files
The files are traditional CSV formatted text files, and can be imported into any number of applications for further analysis or reporting such as Google Sheets or Microsoft Excel.
Tips on working with the data:
- Include column headers when importing data so that you can readily identify the fields. The appendix in this document provides a reference for the data elements.
- After importing, it would be good to name the sheet if you haven’t already done so.
Pivot Tables
One of the main ways to work with this data is by using a pivot table.
- Google: see https://support.google.com/docs/answer/1272900 for more information. To add a pivot table to the current sheet, go to the “Insert” menu and select “Pivot table”.
- Microsoft Excel: see https://support.microsoft.com/en-us/office/create-a-pivottable-to-analyze-worksheet-data-a9a84538-bfe9-40a9-a8e9-f99134456576 for more information. To add a pivot table to the current sheet, select all the data for the current sheet. Go to the “Insert” menu and select “Pivot Table” from the ribbon.
Summarizing Data with Pivot Tables
- To summarize by service providers, select the “saml_sp” field for the rows.
- To summarize by the individual Cirrus Proxy logical instances, select the “tenant” field for the columns
- To count the number of authentications, select the “user” field for the values and select “COUNTA” for the summation
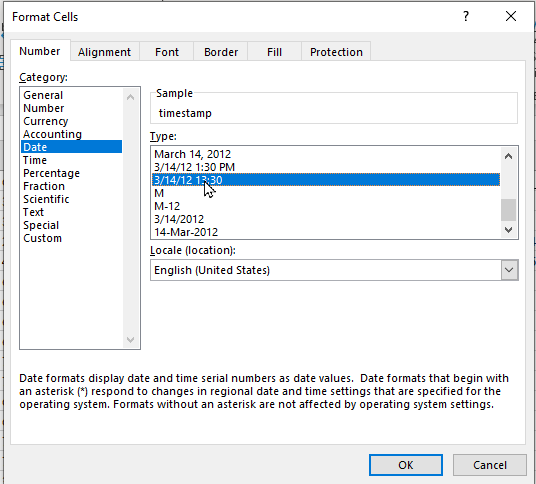
Timestamps in Microsoft Excel
The default import of Excel does not handle the formatting of the timestamp correctly. To correct, select the first column, from the “Home” ribbon, adjust the format and select “More Number Formats…”. Change the format to “Date” and “Type:” of date and 24 hour time as shown below. You should now see timestamps with both dates and times.
Appendix - Data Elements
Common Data Elements
Each downloaded log file will include the following data elements
|
Data Element |
Description |
|
timestamp |
The date and time of the event in UTC. |
|
tenant |
The logical instance of the service - for example if there is a production and a UAT proxy, there will be two different tenants. |
|
orgdomain |
The organization’s domain as configured in Cirrus Identity. |
|
orgurl |
The organization’s orgURL as configured in Cirrus Identity – this will usually match what is registered with InCommon for InCommon members. |
|
orgid |
Future attribute. |
|
service |
The Cirrus Service being reported on - Event Types section. |
|
clientip |
The IP address of the browser agent accessing the service. |
|
correlationid |
An internal identifier generated by the Cirrus Identity logging infrastructure used to correlate transitions across services. |
|
logtype |
The Cirrus Type being reported on - See Event Types section |
|
logsubtype |
The Cirrus Subtype being reported on - See Event Types section |
|
logdata |
Appears when the report format is “raw”. Contains additional data elements specific to each event - see Log Data Elements section |
Event Types
The following table is a current inventory of the logtype and logsubtype values you will find by service.
|
service |
logtype |
logsubtype |
description |
|
bridge |
authentication |
request |
SAML authentication requests made through the Cirrus Bridge |
|
bridge |
authentication |
success |
Successful SAML authentications made through the Cirrus Bridge |
|
bridge |
cas |
request |
CAS authentication requests made through the Cirrus Bridge |
|
bridge |
cas |
login |
Successful CAS authentications made through the Cirrus Bridge using the ‘login’ method |
|
bridge |
cas |
validate |
Successful CAS ticket validations made through the Cirrus Bridge using the ‘validate’ method |
|
bridge |
cas |
serviceValidate |
Successful CAS ticket validations made through the Cirrus Bridge using the ‘serviceValidate’ method |
|
bridge |
cas |
samlValidate |
Successful CAS ticket validations made through the Cirrus Bridge using the ‘samlValidate’ method |
|
gateway |
authentication |
request |
SAML authentication requests made through the Cirrus Gateway |
|
gateway |
authentication |
success |
Successful SAML authentications made through the Cirrus Gateway |
|
idp |
authentication |
request |
SAML authentication requests made through the Cirrus OrgBrandedID |
|
idp |
authentication |
success |
Successful SAML authentications made through the Cirrus OrgBrandedID |
|
proxy |
authentication |
request |
SAML authentication requests made through the Cirrus Proxy |
|
proxy |
authentication |
success |
Successful SAML authentications made through the Cirrus Proxy |
|
proxy |
cas |
request |
CAS authentication requests made through the Cirrus Bridge |
|
proxy |
cas |
login |
Successful CAS authentications made through the Cirrus Bridge using the ‘login’ method |
|
proxy |
cas |
validate |
Successful CAS ticket validations made through the Cirrus Bridge using the ‘validate’ method |
|
proxy |
cas |
serviceValidate |
Successful CAS ticket validations made through the Cirrus Bridge using the ‘serviceValidate’ method |
|
proxy |
cas |
samlValidate |
Successful CAS ticket validations made through the Cirrus Bridge using the ‘samlValidate’ method |
Log Data Elements
The following is a dictionary of additional data available. Not all combinations of service, type, and subtype will report all of these data elements. Please submit a support ticket if you have any questions on these data elements.
When the report format is “parsed”, these elements appear as as individual fields with corresponding headers in the csv file. When the report format is “raw”, these elements appear in JSON format within the logData field.
|
Data Element |
Description |
|
spentityid |
The entityId of the service provider making the request - used by some services, blank for others. |
|
cas_service |
The service URL when using the CAS protocol - blank when the protocol is SAML. |
|
cas_idp_hostname |
The fully qualified domain name of the CAS identity provider when using the CAS protocol - blank when the protocol is SAML. |
|
cas_client_ip |
The IP address of the browser agent accessing the service using CAS. |
|
user |
A calculated value from a cascade of evaluating the ePPN and mail attributes - if there is neither value, the IP address is used. Used for counting traffic. |
|
cas_ticketprefix |
The prefix of the CAS protocol ticket. |
|
cas_isproxied |
Indicator if the CAS transaction was proxied. |
|
saml_idp |
The entityId of the SAML identity provider fulfilling the request (used by some services, blank for others). |
|
sp |
The entityId of the SAML service provider making the request (used by some services, blank for others). |
|
saml_idpchain0 |
For transactions traversing a Proxy or Bridge, the last IdP to make the SAML assertion. |
|
saml_idpchain1 |
For transactions traversing a Proxy or Bridge, the upstream IdP to make the SAML assertion. |
|
saml_spchain0 |
For transactions traversing a Proxy or Bridge, the last SP to request the SAML assertion. |
|
saml_spchain1 |
For transactions traversing a Proxy or Bridge, the downstream SP that requested the SAML assertion. |
|
eppn |
The eduPersonPrincipalName attribute associated with the assertion. If blank, was not part of the assertion. |
|
|
The mail attribute associated with the assertion. If blank, was not part of the assertion. |
|
uid |
The uid attribute associated with the assertion. If blank, was not part of the assertion. |